
If you search for shoppable video conversion benchmarks, you will find that shoppable video triples conversion rates, lifts them by 86%, lifts them by 30%, and produces conversion rates between 9% and 17%.
These cannot all be true. They are describing the same tactic.
We build video apps for Shopify merchants, so we have an obvious interest in you believing the biggest number on that list. Instead, here is what the evidence actually supports, where it falls apart, and how to generate a benchmark that means something for your store rather than for someone’s marketing page.
Why the published numbers disagree so violently
Almost every shoppable video statistic in circulation comes from a company that sells shoppable video. That does not automatically make them wrong, but it does mean three things are usually happening at once.
The comparison is rigged by selection. “Pages with video convert at 4.8% versus 2.9% without” is a real and widely cited figure, but merchants who invest in product video are also merchants who invest in photography, copy, reviews and page design. You are not measuring video. You are measuring the difference between brands that care and brands that don’t.
Watchers get compared to everyone. The most impressive numbers usually measure people who chose to watch a video against all site visitors. Someone who watches 30 seconds of a product video was already further down the funnel than someone who bounced in four seconds. Some vendor reports are explicit about this distinction — Whatmore’s 2026 benchmark study separates watcher conversion uplift (a median of +125%) from sitewide conversion lift (+17–33%), which is a much more modest and much more useful figure. Most reports do not make that separation, and the headline number silently becomes the watcher number.
Absolute rates get quoted without context. Claims that shoppable video funnels convert at 9–17% are usually describing a highly qualified traffic segment — a paid campaign landing on a single product, or a live shopping event with an audience that showed up specifically to buy. For context, typical Shopify store conversion sits between 2.5% and 3%, with strong brands in beauty, fashion and pet categories clearing 5%. A sitewide 17% conversion rate from adding a video widget is not a thing that happens.
The numbers that hold up
Strip out the selection effects and the watcher-versus-everyone sleight of hand, and a reasonably consistent picture remains.
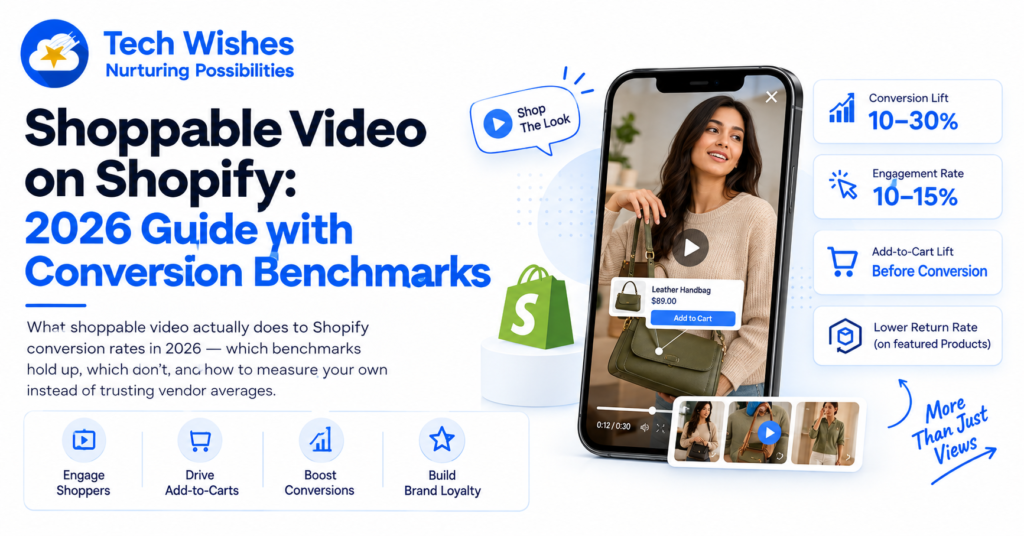
Sitewide conversion lift: roughly 10–30%. This is the band that survives across independent-ish sources. Whatmore’s controlled A/B tests — 200,000+ sessions across seven brands, traffic split 50/50 against a no-widget control — landed on 17–33% sitewide lift, with top-quartile implementations going higher. Other aggregations cluster around 10–30%. Note that this is a relative lift. If you convert at 2.6%, a 20% lift takes you to roughly 3.1%. That is a genuinely good outcome. It is not 3x.
Engagement rate: 10–15% is normal. The share of page visitors who actually interact with the video widget. Above 25% puts you in the top quartile. This is the metric to watch first, because a widget nobody touches cannot lift anything, and low engagement usually points at placement rather than content.
Add-to-cart rate moves before conversion does. Video’s real job is closing the information gap that static images leave open — fit, scale, texture, how the thing actually behaves. That shows up in add-to-cart before it shows up in revenue, and it shows up most on products where photos genuinely fail: apparel, anything with a texture, anything where size is hard to judge, anything demonstrating a transformation.
Returns are part of the return on investment. Less discussed and often more valuable than the conversion lift. If video sets accurate expectations, fewer people order the wrong thing. For apparel merchants running 25–35% return rates, a few points off that number can outweigh the conversion gain entirely.
A reasonable expectation for a competent implementation on a mid-sized Shopify store: 12–20% relative conversion lift, 10–15% engagement, and a measurable dip in returns on the products you feature. If someone promises you tripled conversions, ask what the control group was.
The page speed problem, and what most guides get wrong about it
Here is where most shoppable video advice is confidently incorrect.
The standard warning is that video will destroy your Largest Contentful Paint. Shopify’s own performance team looked at this and found something more specific: the metric video actually damages is Speed Index, not LCP. Pages carrying more than 5MB of video showed a median mobile Speed Index of 14.6 seconds, against 7.2 seconds for pages with no video at all. That is a doubling of perceived load time, and it happens whether or not anyone presses play.
This distinction matters because it changes the fix. LCP problems are usually about your hero image. Speed Index problems are about total weight and the order in which things arrive — which is exactly what a video widget controls.
Three things separate a video implementation that costs you nothing from one that quietly taxes every page view:
Deferred loading below the fold. Video sections that are not visible on initial load should not load at all until the visitor scrolls near them. Modern implementations use the Intersection Observer API for this. Shopify’s Liquid video_tag now applies lazy loading automatically for videos in sections at position three or later, which is a meaningful improvement for theme-native video — but app-injected widgets are outside that system and depend entirely on how the app was built.
No third-party player embeds. A YouTube or Vimeo embed pulls in a substantial payload of third-party JavaScript, iframes and tracking before a single frame plays. On a collection page with multiple embeds, that compounds fast. It also ends playback by showing related videos, some of which will belong to your competitors. You are paying in page speed for the privilege of routing customers elsewhere.
Aggressive compression and sane resolution. 720p is enough for a widget on a phone. A 30-second clip should land under 3MB. Anything shot on a phone gains nothing visible from 4K in a 400px-wide player, and the file size difference is enormous.
The benchmark to hold your implementation to: LCP regression under 150ms, and no measurable change in Speed Index on a product page. Run PageSpeed Insights on a real product page before install and again after. If the numbers move meaningfully, the loading strategy is wrong — and that is an app problem, not an inevitable cost of having video.
This is the part we care about most, because it is the part merchants discover six weeks after installing something, when their Core Web Vitals have quietly gone amber and nobody can say why.
Placement decides the outcome
The same video in a different position produces completely different results.
Product page, below the gallery, above the description. The highest-intent placement and the one that moves conversion most directly. The visitor is already considering this specific product and has a specific unanswered question. Answer it here.
Homepage, as a story-bubble row. Good for engagement and brand, weak for direct conversion. Useful if your problem is that people do not understand what you sell.
Collection pages. Tempting, and usually a mistake. Multiple video widgets on one page is where the page-weight cost concentrates, and the visitor has not yet committed to a product, so the return is thin.
Dedicated shoppable video page or feed. Works if you have real volume of content and drive traffic to it deliberately. Does nothing if you build it and leave it unlinked.
If you are starting with one placement, make it the product page. If you are starting with one product, pick the one with the highest traffic and the worst conversion rate — that gap is usually an information gap, which is precisely what video fixes.
How to generate your own benchmark
Industry averages are for deciding whether to try something. Your own numbers are for deciding whether to keep it. This takes about a month.
- Record the baseline before you install anything. For your test products: conversion rate, add-to-cart rate, average order value, return rate, and product page bounce. Thirty days of data minimum. Screenshot your PageSpeed Insights scores for a representative product page.
- Pick 10–15 products, not your whole catalogue. High traffic, underperforming conversion, and genuinely video-suited. Skip anything a photo already explains completely.
- Use content you already have. Your Instagram Reels, TikToks, and customer UGC are already made and already performed. Most brands have a content bank considerably larger than they think. Producing new video before you have proven the mechanism works is how this project stalls in week two.
- Run it for 30 days minimum, and do not change anything else. Ecommerce data is noisy. If you redesign the product page in week two, you have learned nothing about video.
- Measure five things. Engagement rate (target 10–15%), add-to-cart rate on video products versus your control set, conversion rate on the same comparison, return rate on featured products, and Core Web Vitals delta.
- Compare like with like. Video products against similar non-video products, over the same period. Not this month against last month — seasonality will eat your result and hand you a conclusion you invented.
If you have the traffic for a proper 50/50 split test, run one. Most Shopify stores do not, and a matched-products comparison over 30 days is a perfectly honest second-best.
What this is actually worth
Shoppable video is not a growth hack and the tripled-conversion claims are noise. What it reliably is: a way to close the information gap between what a photo shows and what a customer needs to know before spending money, applied to the products where that gap is widest.
For an apparel, beauty, home or any visually-driven brand, a 12–20% conversion lift on featured products plus a reduction in returns is a solid, unglamorous, real result. It compounds, it costs almost nothing if you use content you already own, and the main way merchants get it wrong is by installing something heavy, putting it in the wrong place, and never measuring whether it worked.
BFCM traffic is the most expensive traffic you will buy all year. If you are going to test this, test it now — you want the measurement period finished and the implementation settled before November, not running an experiment during your highest-stakes month.
Glow Videos is our shoppable video app for Shopify — video galleries, reels and UGC on your product pages, built to defer loading entirely until it is in view, so your Core Web Vitals stay where they were. Free plan available on the Shopify App Store.
Building a video strategy for BFCM and want a second opinion on the implementation? We build Shopify stores and apps at Tech Wishes — get in touch.